2022-06-22, 11:00–12:30, Room 2
Do you need high-resolution data for your machine learning, but you have only areal aggregates? Would you like to present continuous maps instead of choropleth maps? We can transform county-level data into smaller blocks with Pyinterpolate. We will learn how to perform Poisson Kriging on the areal dataset during workshops.
Choropleth maps representing areal aggregates are standard in the social sciences. We aggregate data over areas for administrative purposes and protect citizens' privacy. Unfortunately, those aggregated datasets can be misleading:
- Administrative units, especially in Europe, vary significantly in shape and size,
- Large units tend to be visually more important than smaller areas,
- It is hard to integrate areal data into machine learning pipelines with data at a smaller and regular scale.
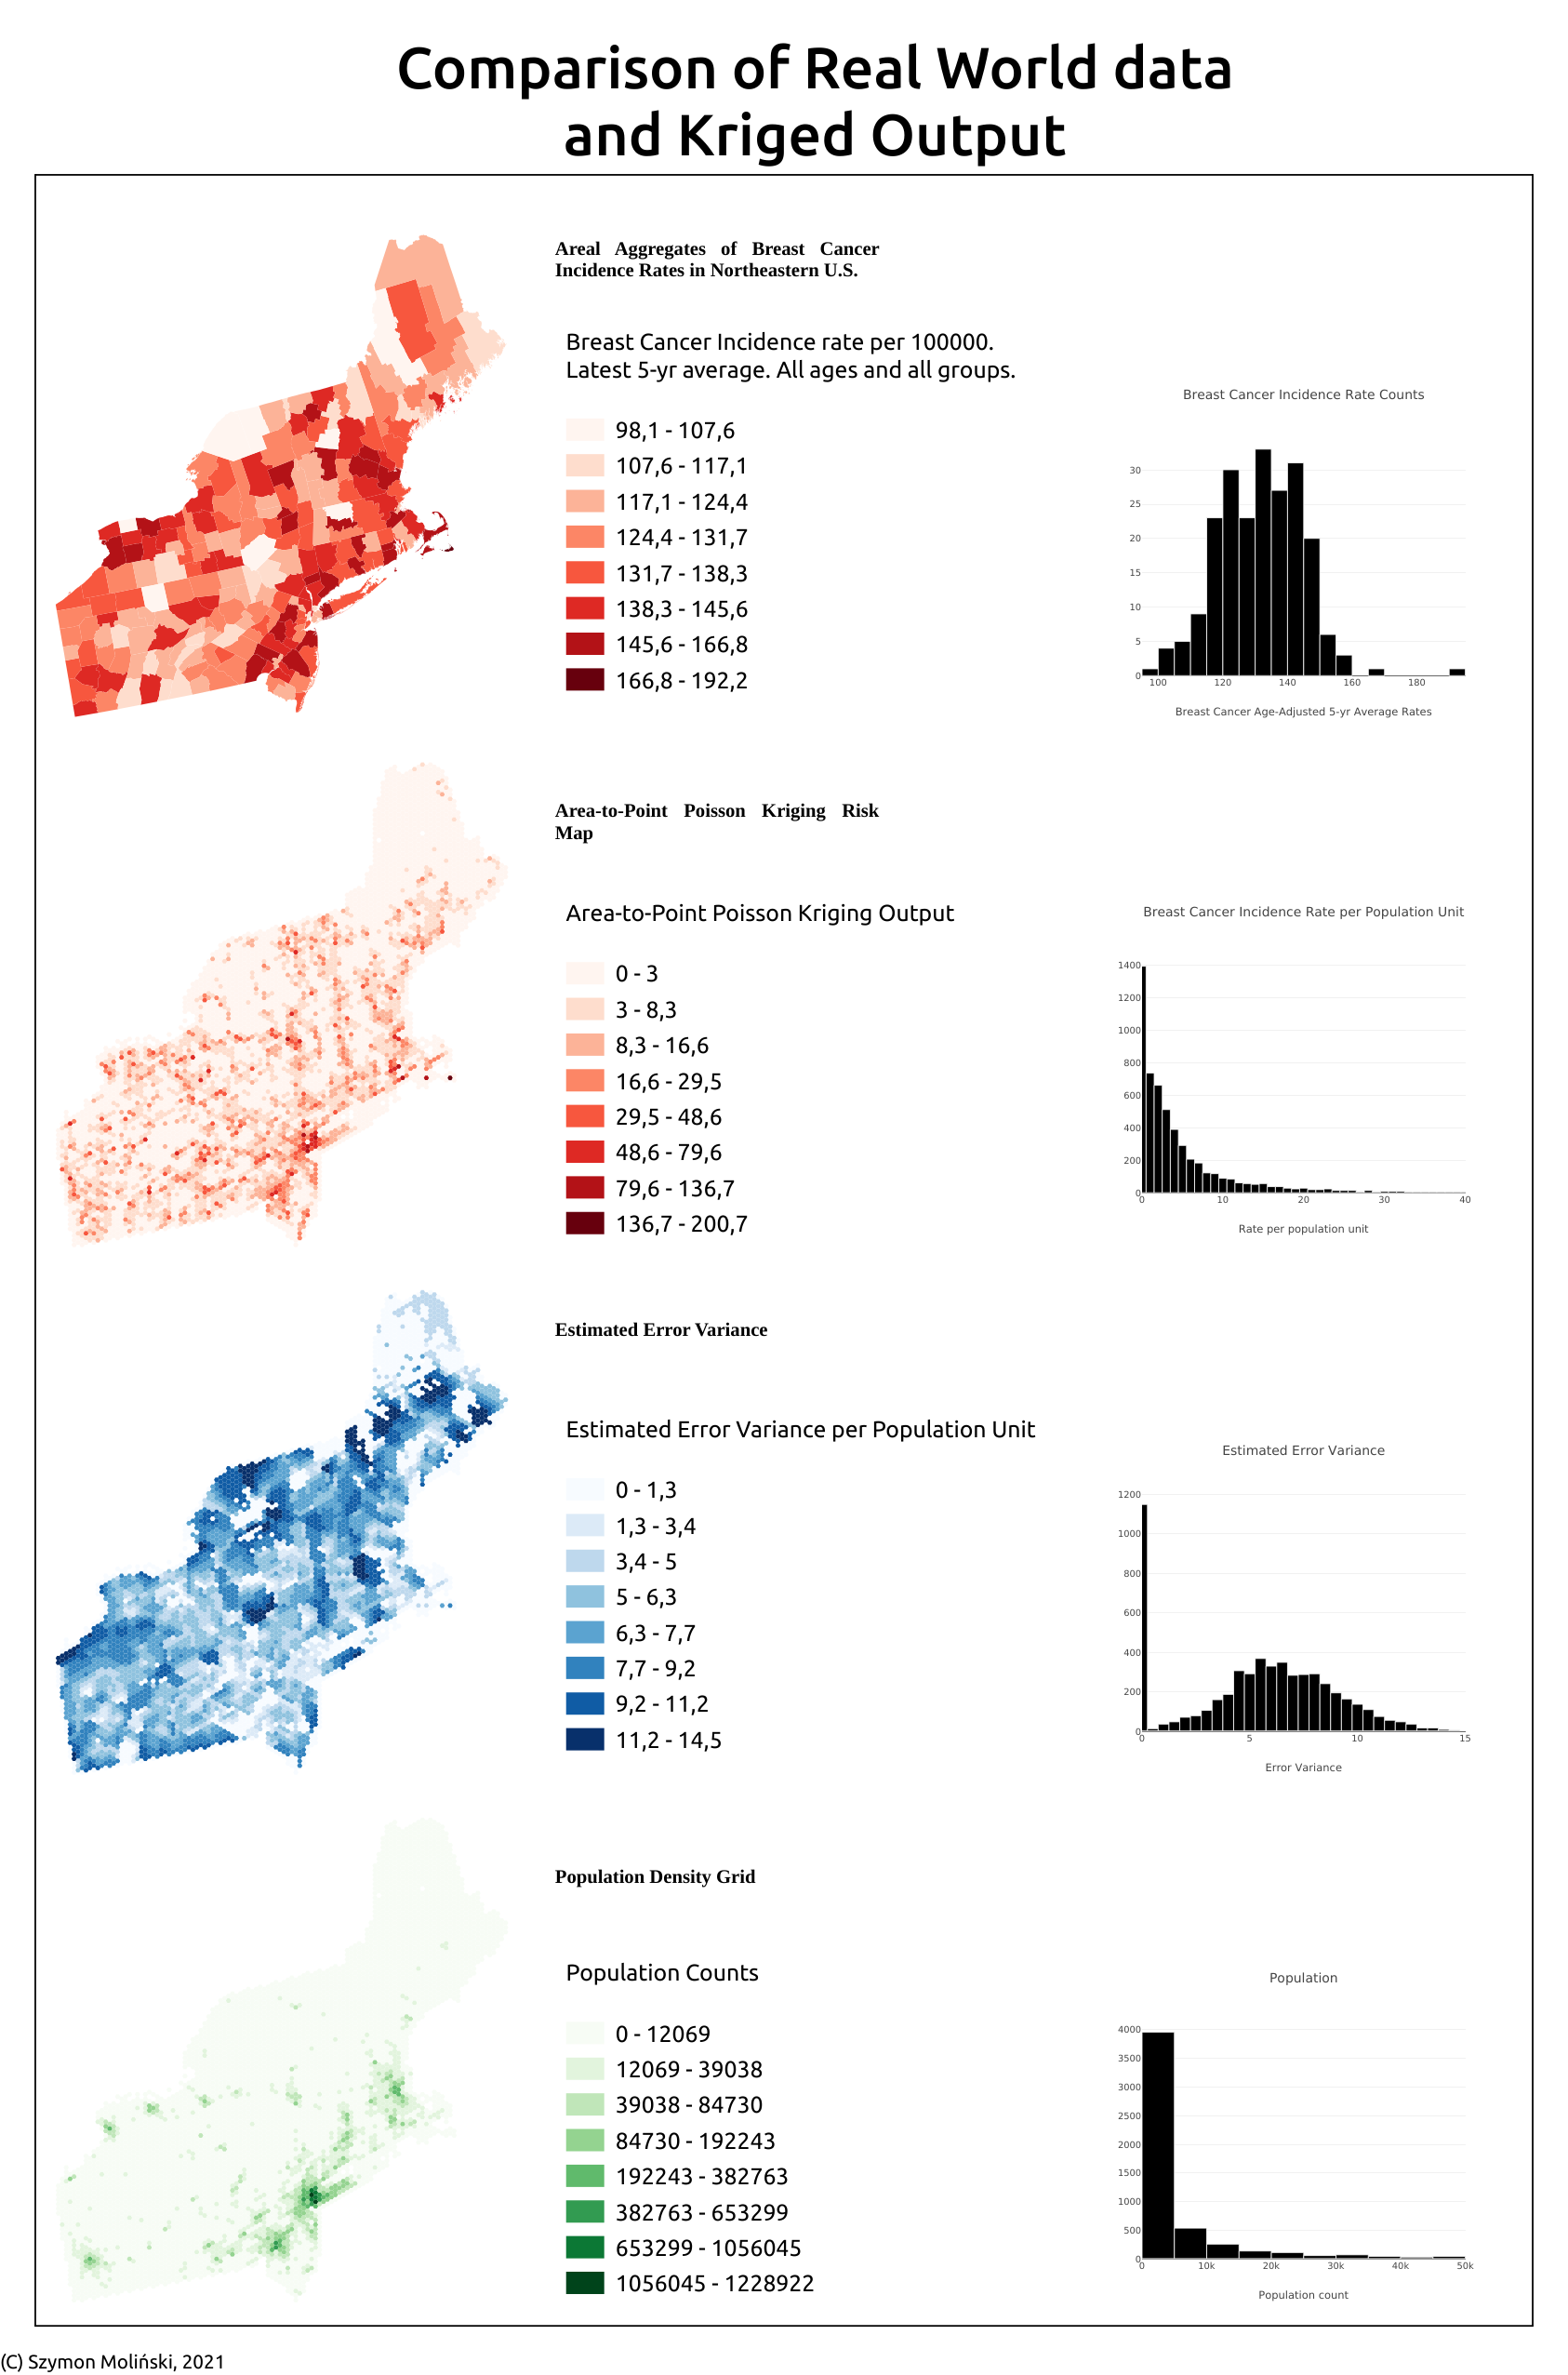
There is a solution for the processes that are spatially correlated and represent rates. One example is the disease incidence rate map. An incidence rate is the number of disease cases per area divided by the total population in this area and multiplied by the constant number of 100,000. Through the denominator (total population), we can divide our space into smaller blocks – in this case, the population blocks. Then we regularize the semivariogram of areal data with the population density semivariogram to obtain a final model that considers fine-scale population blocks and can predict disease rates at a smaller scale. After this transformation, we can:
- show a continuous map of disease rates,
- avoid problems with the visual discrepancy between different areas' sizes,
- use data with better spatial resolution as an input for machine learning pipelines; for example, we can merge data with the remotely sensed information.
We will learn how to transform areal aggregates into smaller blocks during workshops. We will use the Pyinterpole package. We will discuss the most dangerous modeling pitfalls and what can be done with the output data. If you are an expert in the economy, social sciences, public health, or similar fields, this workshop is for you.
Pyinterpolate is a Python package for spatial interpolation. It is available here: https://pypi.org/project/pyinterpolate/